

This business infographic design project was completed on an accelerated schedule to be used in social media channels and to promote a business report about Web Security threats. This business infographic design follows the client brand guidelines, but also extends the brand styles to create a modern and compelling visual infographic design that highlights the key data points requested by the client.
Infographic Design Process
For this infographic design project, the client outlined the desired data/content “panels”, rough messaging for each section, and provided the primary numerical data to be used in this infographic design piece. Based on this data, and the primary headlines and sections of this infographic design, custom iconography and imagery was created and secured to create an impactful infographic design that conveys the keys sets of data the client was interested in communicating to readers.
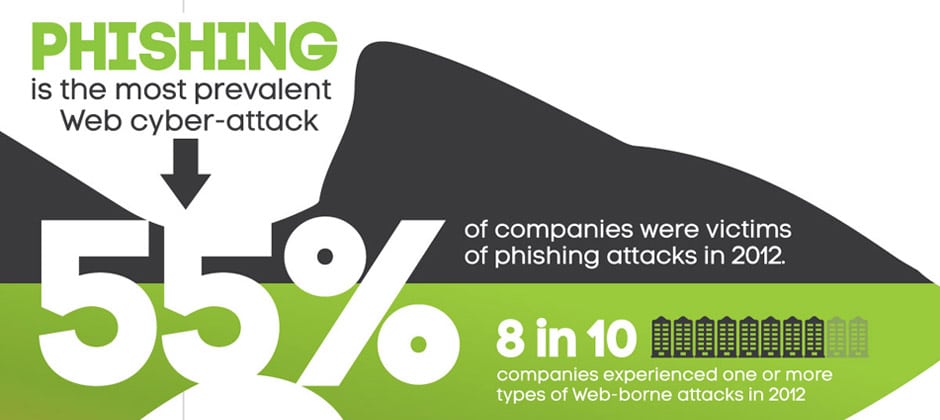
The first infographic design panel content was location-based, so we incorporated a large digital map graphic as the background and located the data point over that graphic in a bold “callout” featuring bright colored fonts and country flags for each location. Just below this map infographic, five data segments are called out with an altered pie-chart style and large percentage numbers to draw the reader into the data. Using large numbers and interesting graphs for the data display really serves the readers well, as they are quickly able to understand the most important data presented in the associated report document.
Another important element in this infographic design is a small line element that follows the flow of the infographic content to help the reader visually navigate the piece. Smaller infographic design elements like building and person icons add to the data-oriented nature of this infographic design project throughout this piece, as well as using a variety of chart and graph styles to keep the content easy to understand in this infographic design. Bold, bright colors are used throughout the infographic design to make key messages and graphics stand out to the reader, as well as oversized, large font typefaces.
After the key data is presented in this infographic design, the final section features a list of steps readers can take based on the data presented, which is an important element for any infographic design proiect. Although there are strong brand elements incorporated throughout this infographic design, the company logo is reserved for the end of the document.
The Final Infographic Design Product
The intended outlet for this infographic design project was primarily web-based for the company website and social media, but we designed the infographic in Adobe Illustrator to allow the maximum flexibility of future use for both web, and scalability to larger sizes for print. Elements from this infographic will certainly be repurposed for future projects for this client to create a consistent look for all final design projects.
